



Every December, I watch friends go through the same chaos — downloading bank statements, hunting for tax receipts, making rushed investment moves before the calendar flips. Meanwhile, corporations have been running methodical close processes for decades. Reconciling every account, reviewing performance metrics, setting precise allocations for the coming year.
The gap between how businesses handle their annual financial close and how individuals handle theirs is genuinely staggering. Most people treat year-end like a fire drill.
Why personal annual closes fail before they start
The typical personal finance year-end looks like this: check investment returns, maybe rebalance if you remember, gather some tax documents, set a vague savings goal. That's not a close — that's just checking boxes.
A real annual financial close means systematically reviewing every financial relationship, reconciling discrepancies, measuring actual performance against targets, and making allocation decisions for the coming year based on what the numbers actually show. Not because it sounds impressive, but because it changes your financial trajectory in ways that are hard to replicate otherwise.
Most people skip this because they assume it requires corporate-level complexity. It doesn't. You need three things: reconciliation templates that actually work, KPI definitions that matter for personal finance, and decision frameworks for the big annual choices around taxes, insurance, and asset allocation.
The operational challenge isn't the math — spreadsheets handle that. It's organizing the workflow so you actually finish it in a weekend instead of letting it drag into February.
Building your reconciliation framework
Corporate closes start with reconciliation for a reason: you can't make smart allocation decisions on bad data. For personal finance, this means more than spot-checking account balances.
Take charge of your finances with clarity and confidence.
Savioly gives you real-time visibility and actionable steps to improve your money management.
- Automated expense tracking
- Goal-based saving plans
- Personalized financial insights
No credit card required
Start with transaction reconciliation across all accounts. Not categorizing every coffee — finding the duplicate transfers between accounts, forgotten dividends sitting in cash, or the insurance refund that somehow never hit.
The first time most people run a proper reconciliation, they find something. Not always dramatic, but rarely nothing. One person I know found several thousand in HSA reimbursements they'd never submitted — just sitting unclaimed because the process felt like a hassle. Another discovered their employer had been under-contributing to their 401k for the better part of a year. Neither would have caught it without actually sitting down and looking.
Your reconciliation template needs five components:
Account Balance Verification
-
Starting balance per your records
-
Ending balance per statement
-
Unexplained variance (should be zero)
-
Action items for discrepancies
Cash Flow Reconciliation
-
Income per tax documents vs bank deposits
-
Major expenses per records vs actual payments
-
Investment contributions planned vs executed
-
Debt payments scheduled vs completed
Investment Performance Check
-
Beginning value plus contributions
-
Minus withdrawals and fees
-
Expected ending value vs actual
-
Performance gap analysis
Liability Verification
-
Outstanding balances per your tracking
-
Statement balances from lenders
-
Interest accrued vs paid
-
Principal reduction targets vs actual
Off-Balance Items
-
Pending reimbursements
-
Expected tax refunds
-
Unclaimed benefits
-
Future commitments already made
Set a timer for a focused reconciliation session to keep the work from stretching out over weeks.
The reconciliation phase typically surfaces a handful of issues that affect your year-end decisions. Fix those before touching KPI analysis.
KPI definitions that drive real decisions
Corporate KPIs work because they tie directly to decisions. Personal finance KPIs often don't — tracking net worth is interesting but it doesn't tell you whether to max your 401k or pay down the mortgage.
Effective personal KPIs for an annual close are about decision thresholds, not vanity metrics:
Liquidity Coverage Ratio Current liquid assets divided by monthly fixed expenses. Anything below six means you should prioritize emergency reserves over aggressive investing. Above twelve suggests cash that probably should be deployed somewhere.
Debt Service Coverage Free cash flow after necessities divided by minimum debt payments. Below 1.5 means you're one disruption from missing payments. Above 3.0 means you could accelerate payoff without meaningful risk.
Effective Tax Rate Trends Total taxes paid divided by gross income, tracked over three years. If it keeps rising, you likely need better tax planning. If it's falling fast, check whether you're missing deductions or underwithholding.
Investment Allocation Drift Actual allocation versus target, measured in percentage points. Drift past 10% in any category is worth rebalancing. Drift past 20% usually means your original targets were wrong to begin with.
Savings Velocity Net worth change minus investment returns, divided by gross income. This strips out market performance and shows your actual savings rate. Consistently below 10% points to lifestyle creep. Consistently above 25% might mean you're holding back on quality of life without a great reason.
These KPIs turn vague feelings into specific triggers. When liquidity coverage drops below six, you stop extra mortgage payments. When allocation drift hits 15%, you rebalance. The numbers take emotion out of it.
Tax decision inputs that actually matter
Year-end tax planning usually focuses on the wrong things. People obsess over refund size or scramble to find deductions. The real decisions are structural — they affect not just this year but your tax trajectory for years out.
First, calculate your marginal utility rate: the actual tax cost of your next dollar of income, including federal, state, and phaseouts. For many people in the $75k–$150k range, once you factor in benefit phaseouts and AMT exposure, that number is higher than they expect.
That figure drives three critical decisions:
Acceleration vs Deferral If next year's marginal rate will be lower — job change, going part-time, retiring — defer deductions and pull income forward. If higher, reverse it. This sounds obvious but most people never actually calculate it.
Roth Conversion Timing Your current marginal rate versus expected retirement rate drives conversion strategy. Factor in ACA subsidy cliffs, education credit phaseouts, and any state tax changes. The sweet spot often shows up in years with temporary income dips — the ones that feel inconvenient but are actually useful.
Estimated Payment Calibration Overwithholding costs you investment returns. Underwithholding triggers penalties. The target is landing right at 90% of current year liability or 100% of last year's, whichever is lower, with the difference invested until April.
Tax decisions cascade through everything else. Get the timing wrong and you're not just overpaying — you're also mistiming investment moves, insurance decisions, and major purchases around them.
Insurance adjustments and self-insurance thresholds
Annual close is when you reset your insurance architecture. Not shopping for better rates — that's just maintenance. This is about recalibrating coverage levels, deductibles, and self-insurance reserves based on where your finances actually stand now.
The key metric: liquid assets minus six months of expenses, divided by potential maximum annual loss. When that ratio starts looking strong, you can raise deductibles and drop certain coverages without taking on meaningful risk.
Most people never adjust insurance after initial purchase. Carrying $500 deductibles with $50k in savings. Maintaining comprehensive coverage on a car worth $4k. The opportunity cost over years adds up to real money.
Annual insurance reset checklist:
-
Increase deductibles to maximum bearable loss — roughly 1% of liquid assets is a reasonable anchor, though it varies
-
Drop collision and comprehensive when car value falls below about 10x the annual premium
-
Eliminate overlapping coverages between auto, home, and umbrella
-
Cancel extended warranties where self-insurance capacity well exceeds any likely claim
-
Adjust life insurance as mortgage balance and dependent needs decline
A couple I know — I'll call them M. and J. — were spending around $8,200 annually on insurance with roughly $140k sitting in liquid savings. After a real review, they got to about $4,900 while actually improving catastrophic coverage. The freed-up cash funded their Roth conversion strategy for the next two years. That's not a small thing.
The allocation reset process
Asset allocation discussions usually stop at stocks versus bonds. But your annual close allocation covers every dollar relationship: checking versus savings, taxable versus tax-deferred, liquid versus illiquid, productive versus protective.
Start with the base/stretch framework for uncertain incomes. Your base scenario sets minimum liquid reserves. Stretch goals define maximum investment allocation. The gap between them is where you have flexibility.
Within investment accounts, don't just rebalance to existing target percentages. Ask whether the targets themselves still make sense.
Time Horizon Changes Every year closer to a goal means less volatility tolerance. A 10-year horizon might support 80% equities. At five years, maybe 60%. At two years, mostly bonds and short-term. These aren't hard rules but the direction matters.
Correlation Shifts Asset correlations aren't stable. When stocks and bonds start moving together — like through most of 2022 — you need real alternatives: commodities, international exposure, or simply more cash than you'd normally hold.
Tax Efficiency Decay As taxable accounts grow, tax-inefficient investments like REITs and high-dividend funds need to migrate to IRAs. This isn't a one-time move — it's an annual optimization that compounds meaningfully over time.
| Tracker Element | What It Tells You |
|---|---|
| Maximum acceptable allocation per category | Hard ceiling before you're overexposed |
| Minimum strategic allocation per category | Floor below which you've lost diversification |
| Rebalancing triggers and thresholds | When to act, not just when to notice |
| Tax cost of rebalancing | Whether the move is worth making this year |
| Optimal account placement per holding type | Where each investment does least tax damage |
Reviewing these elements annually prevents the slow drift that quietly undermines a portfolio over years.
CSV-ready workflows for execution
A solid annual close process means nothing without executable workflows. This is where most personal finance planning falls apart — beautiful spreadsheets that never turn into actual transactions.
Your close workflow needs specific, dated action items:
Week 1 (December 15–21)
-
Download all statements (bank, investment, credit)
-
Run reconciliation templates
-
Document variances over $100
-
Calculate year-end KPIs
-
Generate tax projection
Week 2 (December 22–28)
-
Execute tax-motivated trades
-
Process Roth conversions if applicable
-
Adjust withholdings for final paycheck
-
Review insurance needs
-
Set rebalancing trades
Week 3 (December 29–31)
-
Submit FSA/HSA reimbursements
-
Use expiring benefits
-
Execute rebalancing trades
-
Update automatic transfers for new year
-
Document new allocation targets
Week 4 (January 1–7)
-
Update automated savings rules
-
Adjust insurance coverages
-
Set new KPI monitoring schedule
-
Create quarterly review calendar
-
Export all data to CSV archive
Each action needs five data points: what, amount, account, deadline, and how you'll verify it's done. Without that specificity, a meaningful portion of your planned actions just won't happen.
Here's a simple workflow diagram to visualize the weekly close process.
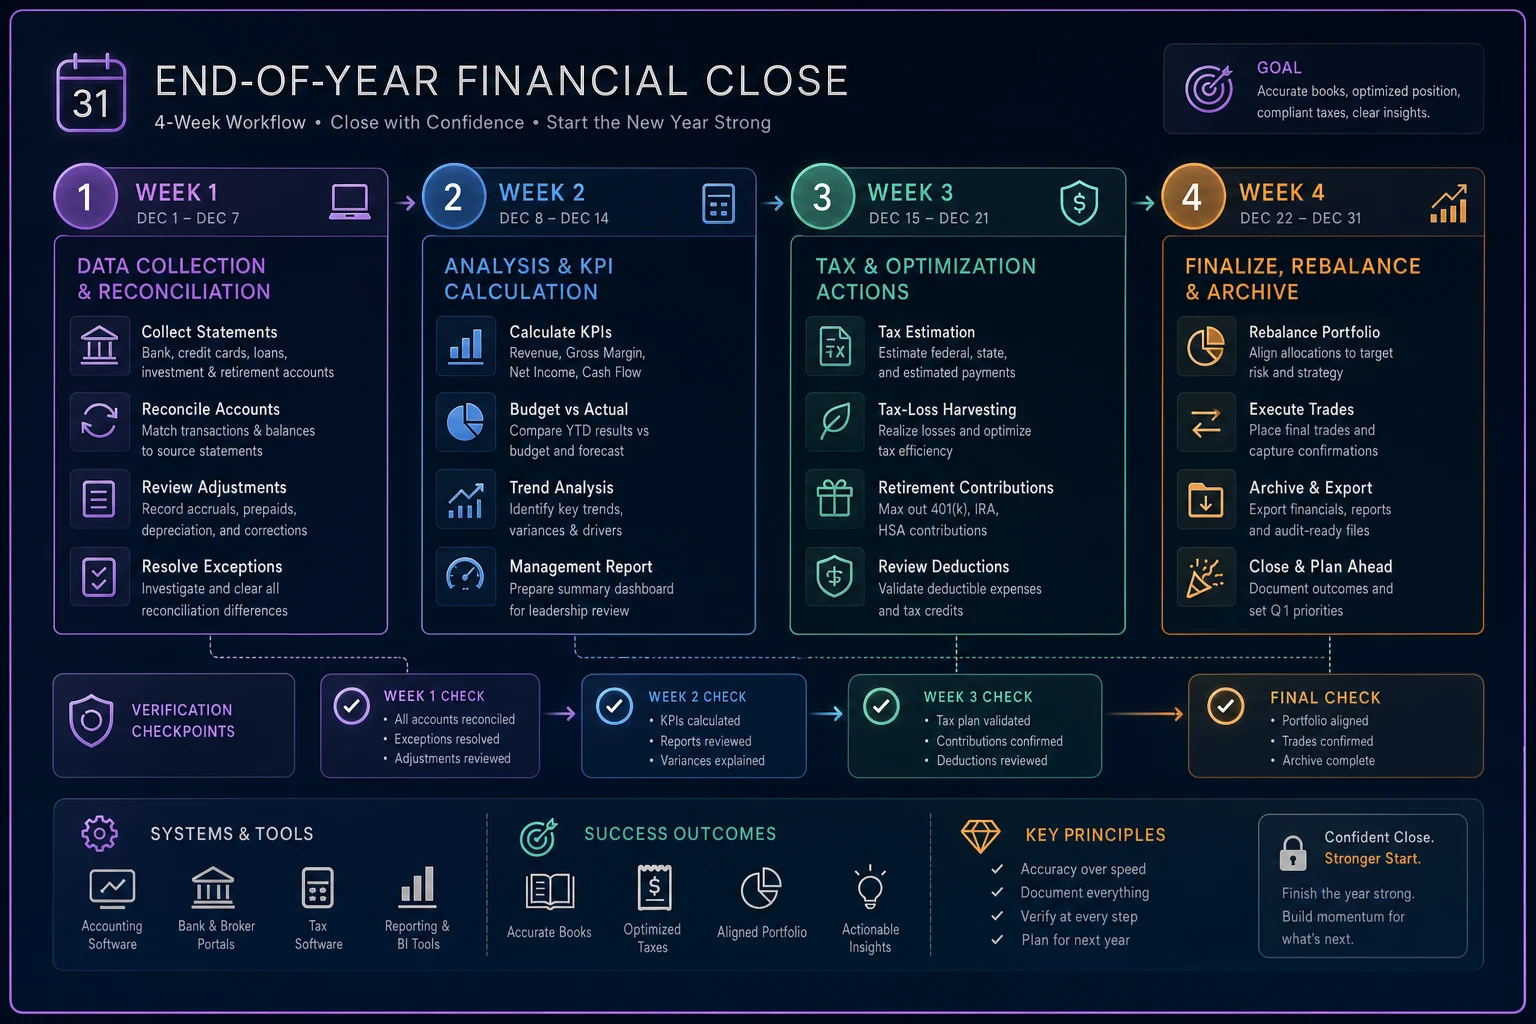
Use this workflow as a checklist during your December close.
Simple tools and templates for tracking
You don't need expensive software for a personal annual close. A well-structured spreadsheet handles everything. But the structure matters more than the tool.
Essential templates:
Reconciliation Workbook
-
Account tabs for each financial institution
-
Transaction matching formulas
-
Variance highlighting
-
Roll-forward calculations
-
Error investigation log
KPI Dashboard
-
Automatic calculation from reconciliation data
-
Trend visualization over 3 years
-
Threshold alerts for decision triggers
-
What-if scenario modeling
-
Monthly tracking between annual closes
Tax Projection Model
-
Current year estimate
-
Multi-year planning scenarios
-
Roth conversion calculator
-
Investment location optimizer
-
Withholding adjustment calculator
Allocation Tracker
-
Current allocation by account and total
-
Target allocation with drift calculation
-
Rebalancing trade generator
-
Tax impact estimator
-
Monthly monitoring template
The key is connecting these templates so data flows automatically. Enter transactions once in reconciliation, and KPIs, tax projections, and allocation analytics update on their own. It's not complicated to set up — it just takes one Saturday to build it properly.
What changes in year two and beyond
Your first annual close takes a full weekend. Year two takes a day. By year three, it's a few hours of verification and adjustment. The efficiency compounds — but more importantly, so does the pattern recognition.
Over multiple years, things become visible that a single review never would have caught. Spending creep in specific categories. Investment costs quietly eroding returns. Tax leakage from poor asset location. Insurance premiums growing faster than the coverage they provide.
More importantly, you start making proactive moves instead of reactive ones. You catch the tax issue in October, not April. You see allocation drift at 8% before it hits 20%. You adjust insurance before renewal rather than after.
After a few years of this, most people realize their original targets were off. The emergency fund was too large. The investment allocation too conservative. The insurance coverage misaligned with actual risks. These aren't failures — they're calibrations that only become visible through consistent review.
Making the process sustainable
The reason most people don't run annual financial closes isn't complexity — it's that the process collapses. January enthusiasm fades by February. It needs to be simple enough to actually finish but comprehensive enough to drive real value.
Start with the minimum viable close:
-
Reconcile bank and investment accounts
-
Calculate five core KPIs
-
Run a basic tax projection
-
Check allocation drift
-
Generate next year's automation settings
That takes three to four hours and covers the majority of the value. Add components as you build familiarity — detailed insurance analysis, multi-year tax planning, alternative investment evaluation, estate planning updates, beneficiary audits. Don't try to do all of it in year one.
Build in triggers for mid-year check-ins too. Income changes over 20%, investment losses past 15%, major life events like marriage or a new dependent, job changes affecting benefits, large unexpected expenses or windfalls — none of these require a full close, just targeted reviews of the areas affected. A simple annual close done every year beats an elaborate process done once.
The compound effect of disciplined closes
Running an annual financial close sounds like corporate overkill for personal finances. But the discipline creates compound benefits that quietly change your financial trajectory over time.
You stop making expensive mistakes. The forgotten HSA reimbursements get claimed. Excess insurance gets cut. Tax-inefficient investments move to protected accounts. Each fix might save a few hundred dollars annually, but ten of them compounding over time becomes real money.
You make better forward decisions too. With clear KPIs and allocation targets, you don't guess whether to pay down the mortgage or invest — you know, based on specific thresholds you've already set. You don't wonder about insurance coverage because you've calibrated it to your actual financial capacity.
Most importantly, you remove emotion from major decisions. When liquidity coverage drops below six, you rebuild reserves. When allocation drift exceeds 10%, you rebalance. When tax rates spike, you adjust. The system runs itself.
The gap between corporate financial discipline and personal financial chaos doesn't have to exist. The same reconciliation principles, KPI frameworks, and allocation processes that keep businesses healthy work just as well for individuals — you just need to translate them into personal terms and build workflows you'll actually stick with.
Next December, while others scramble with year-end chaos, you'll spend a few hours running a templated close process — catching issues early, optimizing proactively, and entering the new year with clear allocation targets and automated systems already in place. That compounds over a decade in ways that are hard to fully appreciate until you're on the other side of it.
Ready to master your money?
Join thousands of users leveraging Savioly to build smarter budgets, save more efficiently, and plan for a secure financial future.